Analytics
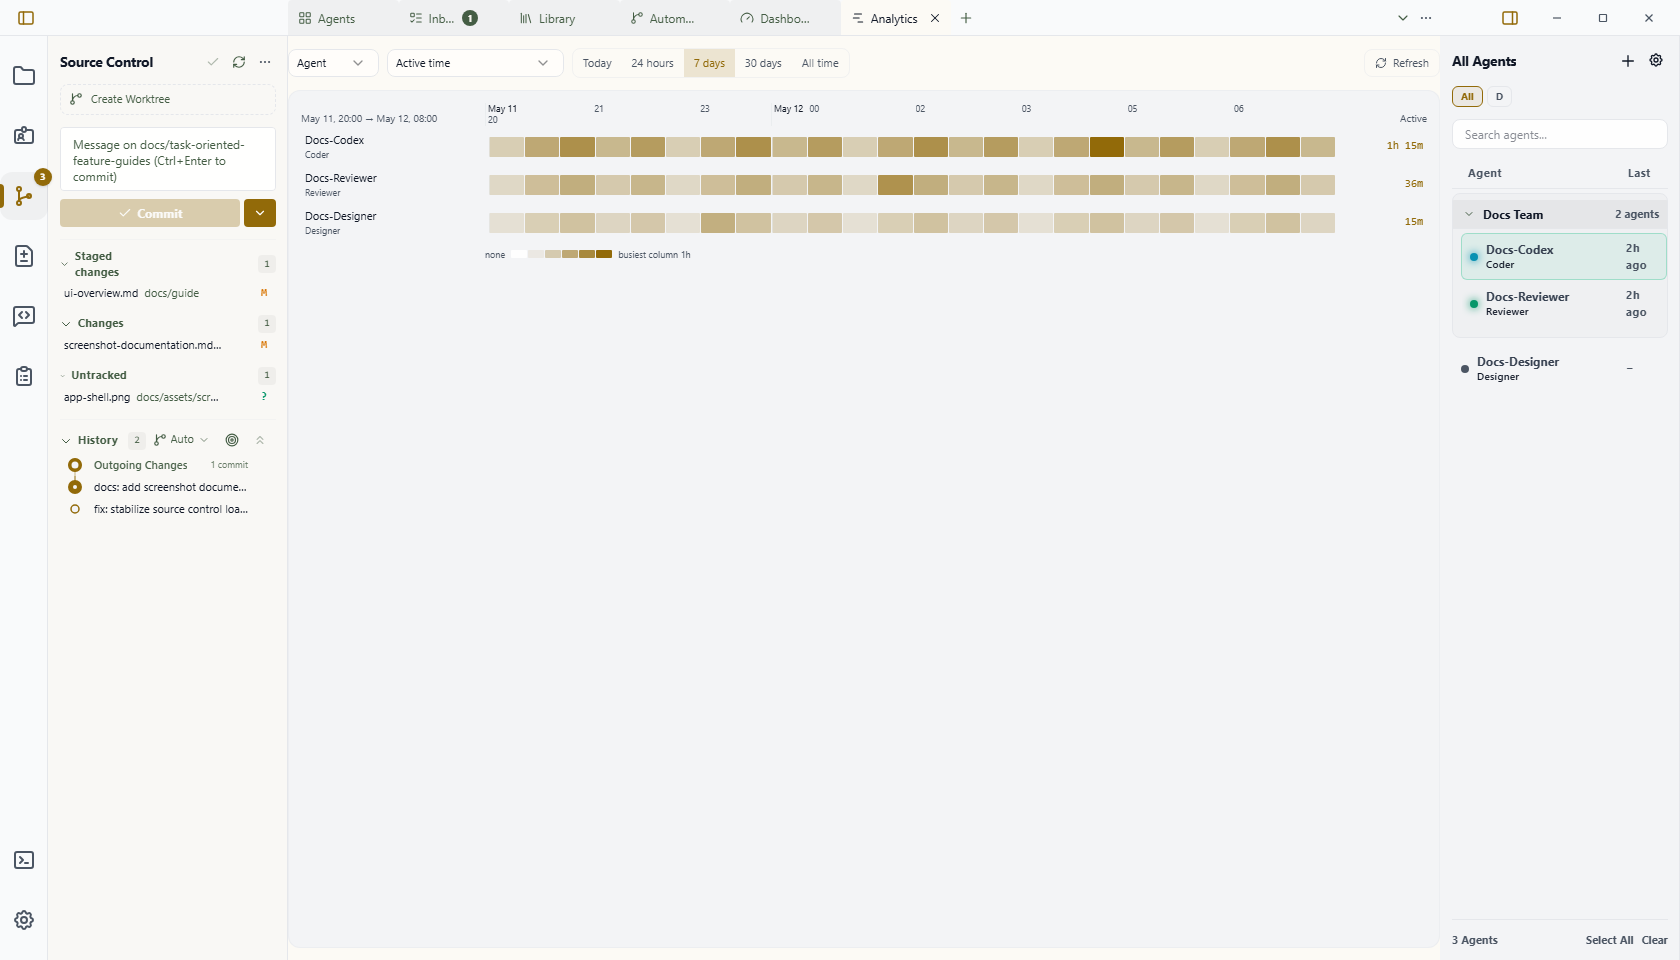
Analytics is a Workbench surface for looking up what your habitat actually did over a period. It draws a matrix: one row per agent, model, or provider, one column per time bucket, shaded by the measure you pick.
Where Dashboard answers is anything wrong right now, Analytics answers how much did X do between A and B. A trailing window is a setting you leave alone; a horizon is a filter you change to answer a question. Keeping them on separate surfaces is deliberate.
When to Use It
- Attribute token spend across providers or models over a week or a month.
- Find when an agent was actually working, and when it was idle.
- Compare agents on one measure without reading each one's terminal.
- Check whether activity is spread out or concentrated in a few bursts.
Basic Automation
- Open Analytics from
Ctrl+P/Cmd+P, a pane's + button, or the empty-pane Home state.Ctrl+Alt+Yopens it directly. - Choose what the rows are: agent, model, or provider.
- Choose the measure. Options are grouped as Work (active time, turns), Tokens (new content processed, new input, cached input, cache writes, output, reasoning, cache hit rate), and Files.
- Choose the horizon: today, 24 hours, 7 days, 30 days, or all.
- Read the matrix. Hover any cell for its exact value and moment; click an agent row to open its combined, own-work, and subagent breakdown. Use Open agent inside the detail view to preserve the usual agent navigation.
The bucket size follows the horizon, and the axis labels the start of each day rather than printing a run of bare hours.
Reading the Matrix
Shading is relative to the busiest cell in the current view, on a square-rooted ramp so that quiet-but-not-empty periods stay visible next to a peak. The scale legend under the matrix says which end is which.
Row totals are not always the sum of the cells. "Files touched" counts distinct files, so a file edited in two different buckets appears in both columns but counts once in the row total. "Cache hit rate" is a ratio, so its total is recomputed over the whole window rather than averaged across the columns — otherwise one idle bucket would carry the same weight as a busy one. Where that applies, the total carries a tooltip saying so.
Cache reads are excluded from the "New content processed" measure; cache writes are not. The two are different things. A cache read replays content the model already processed once, at a fraction of the price, and it runs tens of times larger than everything else — including it would make the matrix a picture of caching rather than of work. A cache write is content the model read for the first time, so it counts. That distinction matters most on Claude, which sends almost nothing as plain input and routes nearly all new prompt content through the cache.
Pick "Cached input" to see the reads on their own, "Cache writes" for the new content, and "Cache hit rate" for the share of the prompt that came from cache.
Active time is measured where a provider reports durations and inferred from gaps between events where it does not. The two are kept apart internally and never blended into a single figure that implies more precision than exists.
Important Limits
- Analytics reads telemetry derived from provider logs. Claude, Codex, OpenCode, and Pi are read from their own session logs. Gemini and antigravity publish no token accounting, so they are read through Wardian's conversation archive and contribute activity and file edits but no token figures. Those appear as blank rather than zero: an agent that reported nothing has not done nothing.
- Not every provider reports every measure. Cache writes are routine on Claude and Pi, and reported as zero by Codex, whose upstream does not bill for them. "Reasoning" is reported by Codex, Pi, and OpenCode, and is already counted inside output, so it is never added to a total.
- History begins when telemetry ingest first read a provider's logs. Sessions whose logs have been deleted cannot be recovered.
- The matrix is a lookup surface. For live state and a monitor you leave open, use Dashboard.
- For per-conversation detail, use Open agent in the breakdown view rather than reading it off the axis.
Related Links
- Dashboard
- Workbench
- Agents
- Wardian CLI —
wardian telemetry summaryreads the same store from a shell